Every coin is somewhere on the curve. Most are in the trough.
Hype Cycle Research is the industry's least trusted research firm. We plot every trending Solana coin on the hype cycle by fixed, printed rules on its real numbers, from Innovation Trigger to the Trough of Disillusionment. Read-only, nothing to sign.
GeckoTerminal's list has no all-time high, so the live curve uses pool age and 1 h / 6 h / 24 h change. Tap or hover a dot for its numbers and the rule that put it there. Where's my coin? adds the real high from its candles.
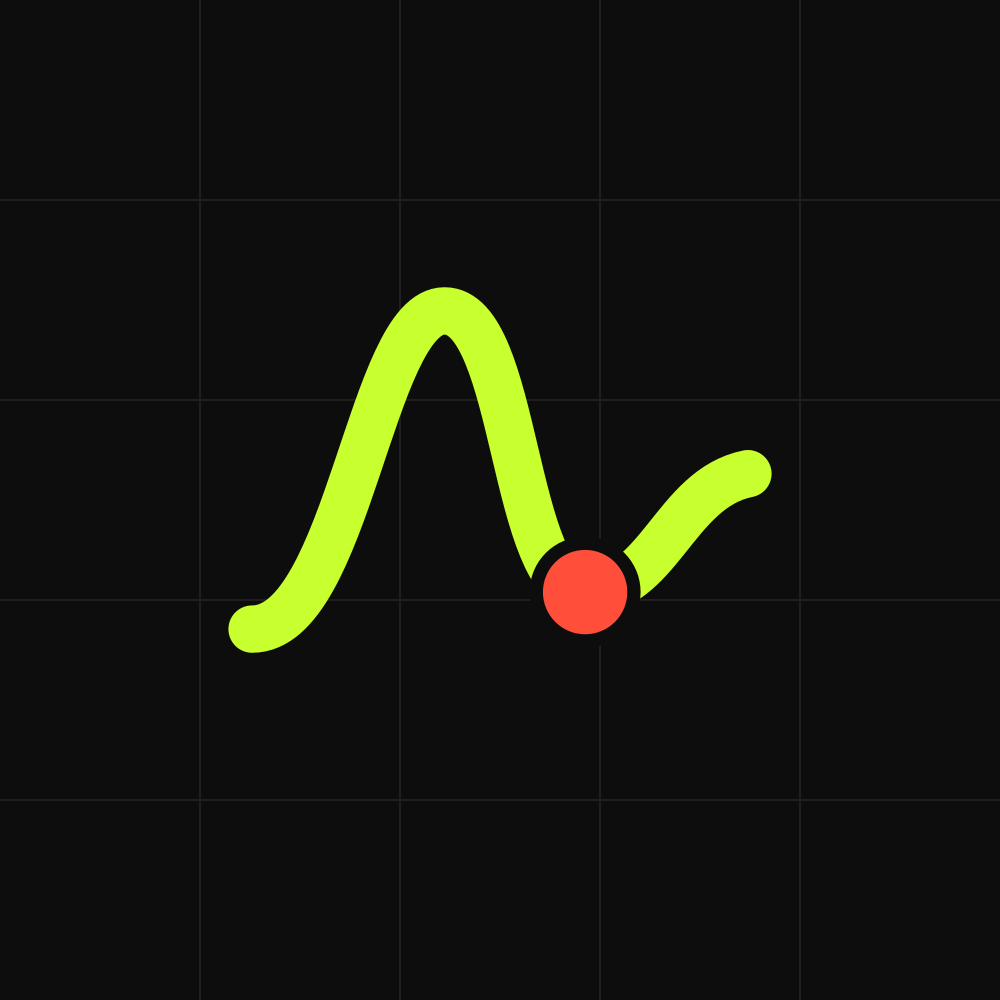
A hype-cycle curve rises from the Innovation Trigger to the Peak of Inflated Expectations, drops into the Trough of Disillusionment, then climbs the Slope of Enlightenment to the Plateau of Productivity. Each trending Solana coin is a dot on it, placed by the printed rules; the phase cards below list them as text.
The five phases
Each coin is placed by a fixed rule on its real numbers. The rule is printed on every card. No vibes were harmed.
Innovation Trigger
Brand new. Nobody knows what it is. Everyone is early.
position: pool age (0 → 2 h)
Peak of Inflated Expectations
Up big. Your group chat is very loud.
position: size of the 24 h pump
Trough of Disillusionment
Down hard. The founders are "heads down building".
position: size of the drop
Slope of Enlightenment
Off the bottom and climbing. Cautious optimism detected.
position: size of the 6 h bounce
Plateau of Productivity
Old, steady, still trading. Basically a utility now.
position: pool age
Nearest phase: a coin no rule catches goes by its 24 h change (≥ +15% Peak, ≤ −15% Trough, 6 h and 1 h up Slope, else Plateau) and its card says so.
Where's my coin?
Paste any Solana coin. We place it on the curve and file an analyst report from its real numbers: one pools read and one candle read.
Read-only. We look, we judge, we touch nothing.
-
-
-
(the take is a joke; the numbers are real)The pin drops when a report is filed. Faint dots are the live trending coins.
The Cope Quadrant
Our flagship ranking. Leaders, challengers, visionaries and niche copers, plotted from real 24 h numbers.
Ability to pump (up/down) = the coin's real 24 h price change on a log scale. The middle line is 0%; +1,000% (up) or −99% (down) reaches the edge.
Completeness of vibes (left/right) = half its 24 h buy share (buys ÷ all trades) + half its unique 24 h buyers on a log scale (10,000 buyers = full marks). The middle line is a score of 50.
Leaders are up with real buyers. Niche copers are down with nobody buying.
Parody of analyst reports. Not affiliated with any research firm. Not advice.What analysts are saying
Real quotes from fake analysts.
"We remain cautiously optimistic about the trough."
"Every coin reaches the plateau eventually. Some reach it at zero."
"The peak is not a strategy."
"Our models are fixed rules. Our conviction is not."
"We have upgraded the trough from 'bad' to 'character building'."
"Past performance is the only performance we can see."
Methodology
Four steps, no wallet, no analysts harmed.
- 01
We read the market
Every few minutes we read GeckoTerminal's Solana trending pools: pool age, 1 h / 6 h / 24 h change, volume, trades and buyers.
- 02
Fixed rules place each coin
Five printed rules put every coin in a phase, from Innovation Trigger to Plateau. The rule that fired is on its card.
- 03
You request coverage
Paste any coin. One pools read and one candle read later, you get its real % from its high and a YOU ARE HERE pin.
- 04
Share the report
Download the analyst report as a PNG. Nothing was signed, nothing was spent, nobody was advised.
The fine print
Hype Cycle is a parody of analyst reports, built on GeckoTerminal's public API in your browser. The data can lag and can be wrong. The phases are fixed rules; the takes and ratings are jokes. Nothing here is financial advice, and nothing here touches a wallet. Not affiliated with any research firm.
- Live curve
- GeckoTerminal's Solana trending pools (24 h), list fields only, one read every few minutes shared by your open tabs. Its top pools are added only when trending gives fewer than 12 coins
- Phase rules
- In order, first match wins: pool < 2 h = Trigger; 24 h ≤ −40% or 6 h ≤ −30% = Trough; 24 h ≥ +50% with 1 h ≥ 0 = Peak; 24 h < 0 with 6 h and 1 h > 0 = Slope; pool > 7 days with |24 h| < 15% = Plateau
- Nearest phase
- Anything left: 24 h ≥ +15% = Peak; 24 h ≤ −15% = Trough; 6 h and 1 h up = Slope; else Plateau. The card says "nearest phase"
- No all-time high
- The lists carry no all-time high, so the live curve never claims one. Where's my coin? adds the real high from one candle read
- Inside a phase
- Position comes from the size of the move (or pool age for Trigger and Plateau); dots are nudged up to ±6 units so they don't overlap
- Dot size + colour
- Size = 24 h volume (log scale); colour = phase
- Where's my coin?
- ONE GeckoTerminal tokens/{mint}/pools read + ONE OHLCV read of its deepest pool, cached a few minutes per coin
- % from high
- Price now vs the highest candle high in the window. "Since the pool opened" only when the window covers the whole pool life; otherwise the window is named. ≥ 50% below the high = Trough
- Analyst take + rating
- Fixed templates fed by the report's numbers. Jokes, labelled as jokes
- Cope Quadrant
- Up/down = 24 h change (log scale, 0% in the middle). Left/right = half 24 h buy share, half unique 24 h buyers (log scale, 10,000 = full)
- Share card
- A PNG your browser draws with the report's real numbers
- On-chain
- Nothing. No wallet, no signature, no transaction, nothing to buy from us
- Affiliation
- A parody. Not affiliated with any research firm, GeckoTerminal or pump.fun
Questions for the analysts
Still confused? Ask @hypecyclelol on X.
Is this real? Does it do anything on-chain?
The numbers are real: every price change, volume, trade count, buyer count, pool age and candle high is what GeckoTerminal's public API returns, read straight from your browser. The research firm is not real, and neither are the analysts. Hype Cycle does nothing on-chain: no wallet to connect, nothing to sign, no transaction and nothing to buy from us. Read-only, always.
Why is my coin in the trough?
Because one printed rule said so. A coin lands in the Trough of Disillusionment when its 24 h price change is −40% or worse, or its 6 h change is −30% or worse. On "Where's my coin?" it also lands there when its price is 50% or more below its highest high in the candle window. The report shows which rule fired and the numbers behind it. Most coins end up there. That's the joke, and also the data.
How do you place coins on the curve?
Fixed rules, checked in order, first match wins: pool under 2 h old = Innovation Trigger; 24 h ≤ −40% or 6 h ≤ −30% = Trough; 24 h ≥ +50% with 1 h ≥ 0 = Peak; 24 h negative but 6 h and 1 h positive = Slope; pool over 7 days with 24 h within ±15% = Plateau. Anything left goes to the nearest phase by its 24 h change, and the card says "nearest phase". Where a dot sits inside its phase comes from the size of the move (or the pool's age). Dot size is 24 h volume.
Why no all-time high on the live curve?
GeckoTerminal's trending list has no all-time high in it, and fetching candles for every coin would blow its rate limit. So the live curve uses what the list really has: pool age and 1 h / 6 h / 24 h change. "Where's my coin?" makes one extra candle read for your coin and adds its real % below the highest high in that window, labelled with how far back the window goes.
What is the Cope Quadrant?
Our flagship ranking. Ability to pump (up/down) is the coin's real 24 h price change on a log scale, with 0% in the middle. Completeness of vibes (left/right) is half its 24 h buy share (buys ÷ all trades) and half its unique 24 h buyers on a log scale (10,000 buyers = full marks). Leaders are up with real buyers; niche copers are down with nobody buying. The names are jokes; the axes are not.
Where does the data come from?
GeckoTerminal's public API: its Solana trending pools for the curve and the quadrant (list fields only, one read every few minutes, shared by your open tabs; its top pools are added only when trending is thin), plus ONE pools read and ONE price-candle read for a coin you paste, kept for a few minutes. Names with slurs or links in them are hidden.
Are the analyst takes and ratings real?
No. The take and the rating stamp are picked from fixed templates by the coin's phase and filled with its real numbers. They are jokes, and the report says so every time: (the take is a joke; the numbers are real).
Is Hype Cycle a real research firm?
No. Hype Cycle is a parody of analyst reports and a memecoin. It isn't affiliated with any research firm, GeckoTerminal or pump.fun. "Hype cycle" is a general idea we're borrowing for a joke, not anyone's methodology.
Is there a $TROUGH coin?
Yes: $TROUGH on Solana, launched on pump.fun. The only official contract address is 5ef3w9Jrgc6fNNmGJPp4q4EderwPuPAAnjt458UHYPE. Hype Cycle is free to use and never needs the coin.
Is any of this financial advice?
No. Hype Cycle sorts public market data into phases by fixed rules. A phase, a quadrant, a rating or a take is not a recommendation or a prediction, and many new coins fail within hours. $TROUGH is a memecoin with no intrinsic value or promise of returns.
Every coin is somewhere on the curve.
Real numbers, fixed rules, unreliable analysts. Find out where yours is.